


 Sign In
Retail Capital Planning: How to Prioritize Store Investments
Key takeaways
Retail capital planning aligns with finance most effectively when every store is ranked on the same verified physical evidence alongside its financial performance.
Standard checklists and weighted scores for condition, ROI, risk, and strategic value send a fixed budget to the strongest return instead of the loudest request.
Matterport digital twins give every store a dimensionally accurate, dated baseline, so teams compare locations and verify conditions remotely.
Every budget cycle, retail leaders face the same math: a fixed capital budget, more requests than dollars, and a CFO who expects every ranking to hold up under questioning. Regional teams each make a case for their stores, and someone has to decide which ones get funded first.
The highest-return capital decisions in retail come from ranking every store on the same verified physical evidence, not just its financials. Without a shared baseline, the loudest request often wins over the best investment.
This guide covers what retail capital planning should achieve, the risks that derail fleet-wide plans, and how to standardize store assessments, score stores, and build a business case finance will approve.
What is retail capital planning?
Retail capital planning is a proactive, multi-year process for prioritizing major investments across stores, facilities, equipment, and locations. Unlike annual CAPEX budgeting, which sets how much money is available, the capital plan decides where and when those dollars go across the portfolio.
Each decision ties into the company's broader finances, so planners account for funding sources, cash flow timing, ROI, payback and repayment capacity, and overall financial feasibility.
In retail stores, capital planning typically covers these investment categories:
Remodels and refreshes: Updating finishes, fixtures, and layouts to restore brand standards and sales performance
Renewals and lease-driven reinvestment: Investing at lease renewals so the store stays competitive for the next term
Expansions and new formats: Adding square footage or opening new concepts to test a different customer experience
Relocations: Moving a store from a constrained or declining site to a stronger one in the same market
Closures and consolidations: Exiting underperforming locations or combining nearby stores into one
Equipment and systems upgrades: Replacing HVAC, refrigeration, lighting, POS, and other systems nearing end of life
Footprint modernization: Right-sizing stores to match current sales density, fulfillment needs, and shopping habits
Done well, retail capital planning supports growth, operational efficiency, resilience, customer experience, and stronger portfolio performance. But every category above depends on knowing what each store looks like today.
Common risks of fleet-wide capital planning
Retail capital planning spans several years, so planners have to model risks that can reorder priorities mid-cycle. The most common risk factors include:
Market disruption and shifting consumer expectations: A format that worked five years ago may require earlier reinvestment or no longer justify capital at all
Construction delays and cost escalation: Delays and rising labor and material costs can push lower-ranked projects out of the funded tier
Supply chain issues affecting fixtures and equipment: Long lead times shift project timing and cash flow, which can change which stores go first
Changing store performance: A store's sales trend can move it up or down the list between planning cycles
Accounting for these risks takes documentation, modeling, and evidence that finance can verify, because anecdotes from the field rarely survive a CFO review.
Many retail capital plans still reduce each store to a spreadsheet row, which doesn’t always effectively expose true conditions or nuances like deferred maintenance, layout constraints, fixture age, and code issues. Without reliable site data, those conditions surface mid-project as scope surprises that can break budgets.
Capital requests from regional teams may also arrive in different formats and levels of detail, making it difficult for the central team to consolidate and validate them. Site visits aren't a scalable fix. They're slow, expensive, and disruptive, and they rarely fit within a budget-submission window.
Store condition data as the groundwork for capital planning
To compare stores fairly, planners need to assess every location based on the same criteria and document them in the same format.
Condition assessment criteria
Start with a standard checklist for every location. At minimum, it should cover:
The building envelope
Interior finishes
Fixtures
MEP systems
Accessibility
Brand standards
Back-of-house condition
Score each element on a simple 1-to-5 condition scale, with a written definition for every score so regional teams rate stores the same way. For example, a 1 might mean “failed or unsafe, needs immediate replacement,” while a 5 means “like new, meets current brand standards.”
Pull centralized asset and facility data into each assessment, including the condition, age, location, lifecycle stage, warranty status, and maintenance history of major assets. Together, these inputs show both the current state of a store and how soon it will need capital.
How to capture a verifiable record of stores
Photos are the default way to document retail store conditions, but they fall short for capital planning. They only show what the photographer chose to frame, miss the rest of the space, and carry no reliable dimensions.
A digital twin closes those gaps: as an immersive, measurable 3D model of a physical space, it allows planners to walk through current conditions from anywhere, without traveling to the location.
Stores captured with the LiDAR-based Pro3 camera are accurate to within 20mm at 10 meters, precise enough to base remodel scopes and cost estimates on.
Each model automatically generates measurements such as square footage, room dimensions, and ceiling heights. For anything more specific, like fixture spacing or door openings, planners can take their own measurements directly inside the model using Measurement Mode, so there’s no need to arrange another visit to the location.
A digital twin is a snapshot of the store on the day it was captured. That means teams should recapture after any remodel, fixture reset, or major repair to keep the baseline accurate.
Retailers without internal capture staff can hand the scanning to Capture Services, where professional technicians scan locations at scale. The Enterprise Service covers more than 700 cities with no property size limit, and twins can be ready in as fast as 24 to 48 hours. The result is a dimensionally accurate, dated record of every store, giving planners one consistent baseline to compare.
Documenting condition findings in context
A capture shows what a store looks like, but a finding is only actionable if it stays anchored to where it occurs. A cracked slab or failing rooftop unit means little as a spreadsheet line someone has to match back to a location later.
Attach condition notes, maintenance flags, and capital-need annotations onto the exact spot an issue appears using Tags, so a remodel scope can be drawn straight from the evidence instead of a secondhand description.
Condition calls also rarely belong to one team. Retail facilities management teams know the equipment age, while the real estate team owns the lease timeline, and finance manages the budget. Notes let teams mention each other, discuss priorities, and share files in context, so no thread is lost between departments.
A shared tagging convention makes findings searchable and comparable across the fleet. With consistent labels such as “HVAC end of life” or “flooring replace within 2 years,” a central team can pull every store with the same issue and total similar needs across regions when building the plan.
Standardized capture and tagging give the central team evidence it can validate remotely, rather than relying on regional accounts.
How to create a scoring model and rank store investments
A scoring framework for a retail capital plan combines financial performance with verified physical condition, so every capital request competes on the same terms.
1. Score each store across weighted criteria
Score each store based on six criteria:
Physical condition: Details from the standardized condition assessment
Risk: Safety, compliance, and failure likelihood for major systems
ROI and payback period: Projected return and time to recover the investment
Revenue potential and market strength: Sales trends, trade area data, and competitive position
Operational impact: Effects on staffing, throughput, and customer experience
Strategic value: Flagship status, format testing, or market importance
Assign a numerical score to each criterion. For example, a 1-to-5 score where 5 means the strongest case for investment. Rank based on need; for physical condition and risk, a store in poor condition or with high failure risk should score high, rather than low, because it needs investment more.
Next, weight each criterion by how much it should count. A balanced starting point might judge physical condition and ROI as the most important markers, and assign them a weighting of 25% each, while revenue potential and risk account for 15% of the score, and operational impact and strategic value 10% each. To get a store's weighted score, multiply each criterion's score by its weight and add the results.
Weights should match company priorities. A growth-focused retailer might shift weight toward revenue potential, while one managing an aging fleet might consider the condition and risk more important.
This hypothetical example compares three stores using the sample weights:
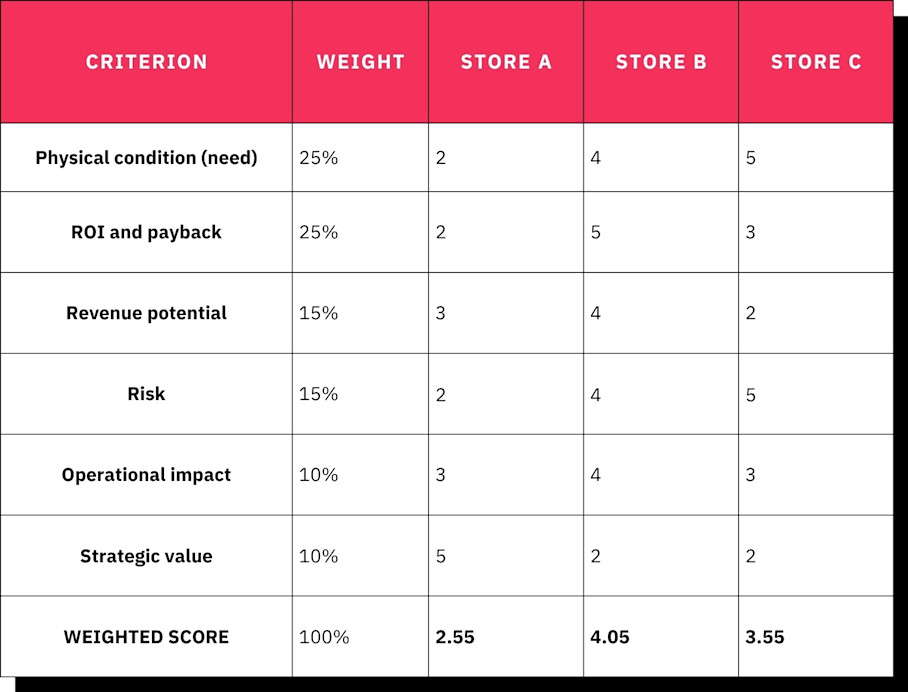
Store A has the highest strategic value, but its low ROI, sound condition, and low risk mean it ranks last at 2.55 and doesn’t need capital urgency. Store B leads at 4.05 because a strong return and poor condition point to a clear need. Store C lands second at 3.55, driven mostly by condition and risk.
Weighted scores replace negotiation with a ranking every stakeholder can inspect.
2. Map scores to remodel, renew, relocate, or exit decisions
Once every store is scored, the pattern across criteria points each one toward a decision path:
Strong performance, poor condition → Remodel
Strong performance, good condition → Lighter renewal
Strong market, constrained site → Relocation
Weak performance, high capital need → Closure or consolidation
Comparing stores on these paths requires consistent spatial data. Property Intelligence generates square footage, room dimensions, and labeled layouts directly from a Matterport digital twin, in the same format for every captured store. Planners can then compare a constrained site against a prototype footprint without requesting drawings.
The same data lets planners model retail space management scenarios before committing capital. They can use the model as a foundation for testing right-sizing a footprint, consolidating two nearby stores into one, or fitting a new format into an existing box.
Clear decisions keep the conversation on what each store needs next. Instead of debating whether a store deserves capital, teams decide what kind it needs.
3. Combine physical and financial data into one source of truth
A retail capital planning model is only as reliable as its inputs. The spatial baseline should connect with financial, operational, facilities, and performance data, so each store's score draws from one record. When those sources live in separate systems, scores drift, and teams end up debating whose numbers are right.
One practical step is to link each store's digital twin to its row in the capital planning model. That way, a finance partner reviewing a condition score can click through to the tagged findings, measurements, and capture date behind it.
A ranking holds up when anyone can trace each score back to the conditions behind it, giving real estate, facilities, and finance a shared reference they can all check.
What does a capital plan your CFO will approve look like?
Finance pushes back hardest on close-or-invest recommendations backed only by anecdote. The best defense is evidence anyone can inspect.
Each location's business case should include:
The scored ranking with documented weighting
Verified dimensions and square footage
Tagged condition evidence
Change comparison since the prior capture
Estimated cost with a scope-certainty rating
Projected ROI and payback
Alternatives considered
A few of those items are hard to make credible with a photo. A change comparison, for one, has to show the same store then and now. Place two store captures Side-by-Side (public beta) so a deferred repair that worsened or a reset that held up is visible rather than asserted, which turns “conditions have declined” into something finance can see for itself.
The rest comes down to letting decision-makers inspect the evidence directly instead of taking it on faith. Guided Tours let a planner walk a CFO or board through the exact spots behind each recommendation, in a defined sequence, so the case stays anchored to the store rather than a slide. Digital twins are shareable, so finance can open them and verify condition claims on their own, settling whether a photo is representative or three years old before it becomes a debate.
A documented baseline also shortens the next planning cycle. Scores update against a known starting point instead of being rebuilt from scratch, which helps teams hit budget-submission deadlines.
Close the loop once projects finish. Recapture each store, compare it against the funded scope, and report actual outcomes against the ROI that was promised.
In early 2022, BMO began acquiring 503 branches from Bank of the West, each needing a rebrand. BMO captured every location within three months, then used the twins to assign each branch a tiered design package, from a full overhaul to minor changes. The bank recouped roughly 6,000 hours of survey work and saved more than $500,000 in 15 months from reduced travel and site visits.
Prioritize store investments with verified visual evidence
The strongest retail capital plans rank every store on the same verified physical evidence, alongside its financial performance. Standardized assessments, a weighted scoring model, and digital twins linked to each score give real estate and finance one shared view of the portfolio.
Pilot-test your scoring model on 10 to 20 freshly captured stores before the next budget cycle. Tests the criteria, weights, and tagging convention on real requests. Once the model holds up with finance, teams can expand it fleet-wide.
Get in touch with our team