


 Connexion
How to Compare 3D Models to Validate Construction Milestones
Key takeaways
Comparing 3D models from different construction milestones helps teams see what changed, what was completed, and what still needs attention, without relying solely on photos or repeat site visits.
A reliable comparison involves capturing consistent data, aligning the models, and then using visual or geometric comparison methods to identify changes between milestones.
Matterport digital twins make milestone comparison easier with browser-based, in-context review, while tools for measurements, annotations, and data exports support more detailed validation and BIM workflows.
Two scans of the same jobsite, captured weeks apart, can tell you almost everything you need to know about progress. When you compare two 3D models of the same project at different milestones, you can see what got finished, what changed, and what fell behind, all without driving back to the site.
The alternatives are painful: scroll through hundreds of site photos hoping to find the right angle, or book yet another walkthrough that eats a day and a plane ticket. Neither approach gives you a clean before-and-after view, and both stall project approvals.
This guide walks through when and how to compare two 3D models for milestone reviews. You'll learn how to choose the right data, run the comparison, and share what you find.
Using 3D models to review project progress
AEC professionals compare two 3D models to spot the visual and geometric differences between two captures of the same space. One capture acts as a baseline. The other shows current conditions, and the differences between them tell the story of the work.
Teams typically compare construction milestones like framing to fit-out, rough-in to closeout, and existing conditions to design intent. This kind of review supports several everyday jobs.
Confirm completed work before approving the next phase: Verify that the current milestone is actually done before you sign off and release the next crew.
Catch missing or out-of-sequence work early: Flag a skipped step or a trade working ahead of schedule while there's still time to correct it.
Document in-wall conditions at rough-in: Capture piping, wiring, and ductwork before drywall closes everything up.
Create a visual record for owners and inspectors: Keep a paper trail of conditions that holds up in reviews and claims.
Comparing hundreds of photos across multiple visits is slow, and captures reviewed in isolation lack the context you need to catch a change fast. A synchronized comparison is a far more efficient method of completing the workflows listed.
Choosing the right 3D data for comparison
The types of comparison you can do vary across different data types. A quick progress check and a tolerance-level QA/QC audit call for different formats and different levels of rigor. Below are the three data types a construction team runs into most, and what each one does best.
Digital twins
A digital twin is a navigable, photorealistic 3D model of a space, created using reality capture technology. It's the most accessible format for non-technical stakeholders because anyone can walk through it in a browser, and no specialized software is required.
Comparing two digital twin captures is best suited to construction progress monitoring, where the goal is to see change in context. You might examine the same room at two different milestones to confirm that finishes, fixtures, and lighting went in as planned. With a digital twin, a project manager can pull up both scans and toggle between them. They'll see what was finished and what's still outstanding, without scheduling a walkthrough.
Digital twins provide full spatial context, giving stakeholders an understanding that isolated photos and raw point clouds can't. A pipe in a photo is just a pipe; in a digital twin it runs through a specific wall on a specific floor, next to the fixtures it serves.
Unlike some more complex model types, digital twins are easy for non-technical users to navigate and interpret. Navigation is intuitive, so it's hard to lose your bearings the way you might in a point cloud built from a field of dots. An owner or inspector can read a digital twin model the way they'd read the room in person, so approvals no longer wait on the one person who can drive the software.
Meshes and point clouds
A point cloud is a set of millions of individual 3D points, each with a real-world coordinate, that together describe the surfaces of a space. A 3D mesh connects those points into a continuous surface of triangles, producing a solid-looking model you can texture and render.
Both represent geometry, and they can be compared against each other for different jobs. Here's how they are typically paired for comparison:
Mesh-to-mesh comparison is useful for examining visual surface changes and volumetric review across full areas.
Point-cloud-to-point-cloud comparison demonstrates precise geometric deviation between two captured conditions.
Point-cloud-to-mesh comparison helps to verify captured reality against a modeled or reconstructed surface.
These data types also serve as the foundational geometric blueprint for creating digital twins. Teams using Matterport’s digital twins can export point cloud and mesh geometry as deliverables for comparison, including registered E57 point clouds for higher-density work.
Denser point clouds support more precise geometric comparison, while sparse data reduces the accuracy of what you can measure. Matterport’s Pro3 camera delivers a point cloud accuracy of approximately ±20 mm (2 cm) at a 10-meter range, which suits progress documentation, volumetric review, and coordination against a design model, where the job is to see and measure change. For survey-grade QA/QC comparisons where millimeter-level deviation is a concern, terrestrial laser scanners are usually required.
BIM and design models
Design-intent comparison checks a BIM or CAD design model against an as-built capture to confirm that what got built matches what was designed. Instead of comparing two field captures, you're comparing the plan to reality. A common example is verifying MEP rough-in position against the coordinated model before walls close, so any misplaced ducts or conduits are caught while they’re cheap to fix.
BIM models tend to be more useful for QA/QC validation, since they carry the design tolerances and coordinated geometry you measure against. Matterport’s digital twin data can be delivered as BIM files in .RVT and .IFC formats at LOD 200. These are ready for use in tools like Revit, AutoCAD, and ReCap, so teams can run design-versus-as-built deviation checks downstream without extra file conversion.
How to compare two 3D models
Use a repeatable sequence for reliable 3D model comparisons. How you capture, align, measure, and document should be consistent each time, so the differences you surface reflect real changes on the jobsite rather than variation in your own method between visits. Here's a step-by-step workflow for comparing two 3D models, from capture through to sharing findings.
1. Capture both models
Capture each milestone using the same coverage and similar lighting conditions so the only differences you see are real construction changes rather than artifacts of how you scanned. If you already have datasets from earlier phases, convert those into a comparison-ready format.
Pay attention to capture accuracy, which makes for dependable existing-condition data across phases. The Pro3 camera uses LiDAR capture, working reliably indoors and outdoors, even in direct sunlight.
Teams without a Matterport camera, or who want to use survey-grade data, aren't locked out. You can import existing laser scans into the workflow using the industry-standard E57 point cloud format, so data from other capture systems can join the comparison.
2. Confirm scale and coordinate systems
Mismatched scale or coordinate systems produce false differences that look like construction changes but aren't. If one model reads in feet and the other in meters, or the two captures sit in different origins, the comparison flags phantom deviations everywhere and buries the real ones.
Run this quick checklist before comparing:
Units: Confirm both models use the same measurement units.
Orientation: Check that both share the same up-axis and north direction.
Shared reference point: Establish a common origin or control point both datasets reference.
Level and elevation: Verify floor elevations line up between captures.
Clearing these four items can save hours of coordination later. This step matters most for geometric work with point clouds and meshes, where you're aligning raw coordinate data. If you're comparing two digital twins of the same space visually, a platform like Matterport will handle scale for you.
3. Align and register the two datasets
Registration is the process of bringing two datasets into the same coordinate space so they overlap correctly. It usually happens in stages:
A rough alignment gets the two models roughly on top of each other.
Point-pair registration then matches common points to refine that fit.
Iterative Closest Point (ICP) nudges the surfaces into precise agreement.
Poor alignment is the single most common cause of misleading comparison results, so it's worth doing carefully. Matterport's software removes most of the manual effort that trips teams up, automatically aligning and registering individual capture points in digital twins so the two models line up precisely.
4. Run the comparison
With both models aligned, use a comparison method that fits the question you're answering. Each one has a moment where it's the right tool.
Side-by-side visual review: Use it when you want quick, in-context progress confirmation for any audience.
Overlay or toggle: Use it when you need to flip between two states in the same view to spot what moved.
Colorized deviation maps: Use them when you need to measure how far as-built strays from design.
Added/removed/changed geometry highlighting: Use it when you want the software to call out exactly what appeared or disappeared.
Distance or tolerance-based comparison: Use it when installations have to fall within a defined tolerance.
Results are usually visualized through color gradients, heat maps, or annotated views, depending on the method.
Matterport’s Side-by-Side (public beta) view displays Matterport digital twins from different milestones in a synchronized view. As you navigate one, the other follows, so change jumps out without switching between models. You can see how a site changed between two points in time to document construction progress week to week or record a property before and after work.
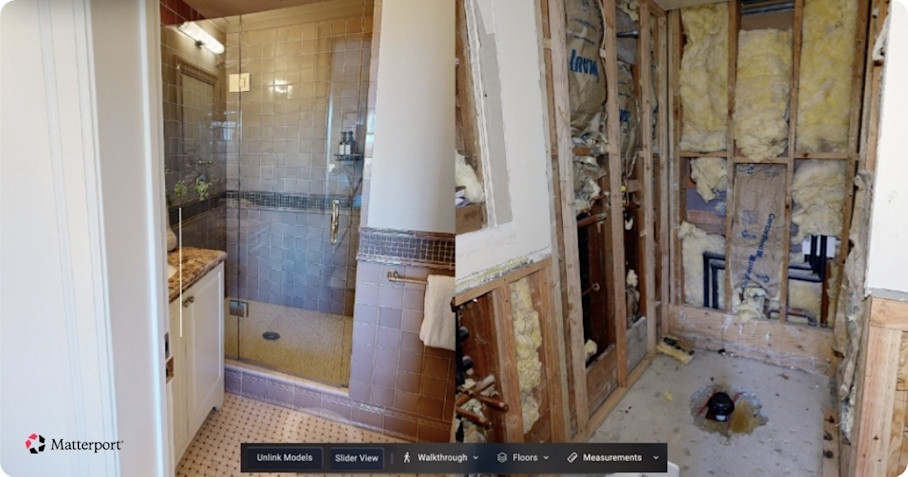
5. Review changed, missing, or added areas
Next, translate the output into construction decisions. Walk the comparison and sort what you see:
What's complete and ready to approve?
What's missing and needs a crew?
What changed from the plan and needs follow-up before the next phase?
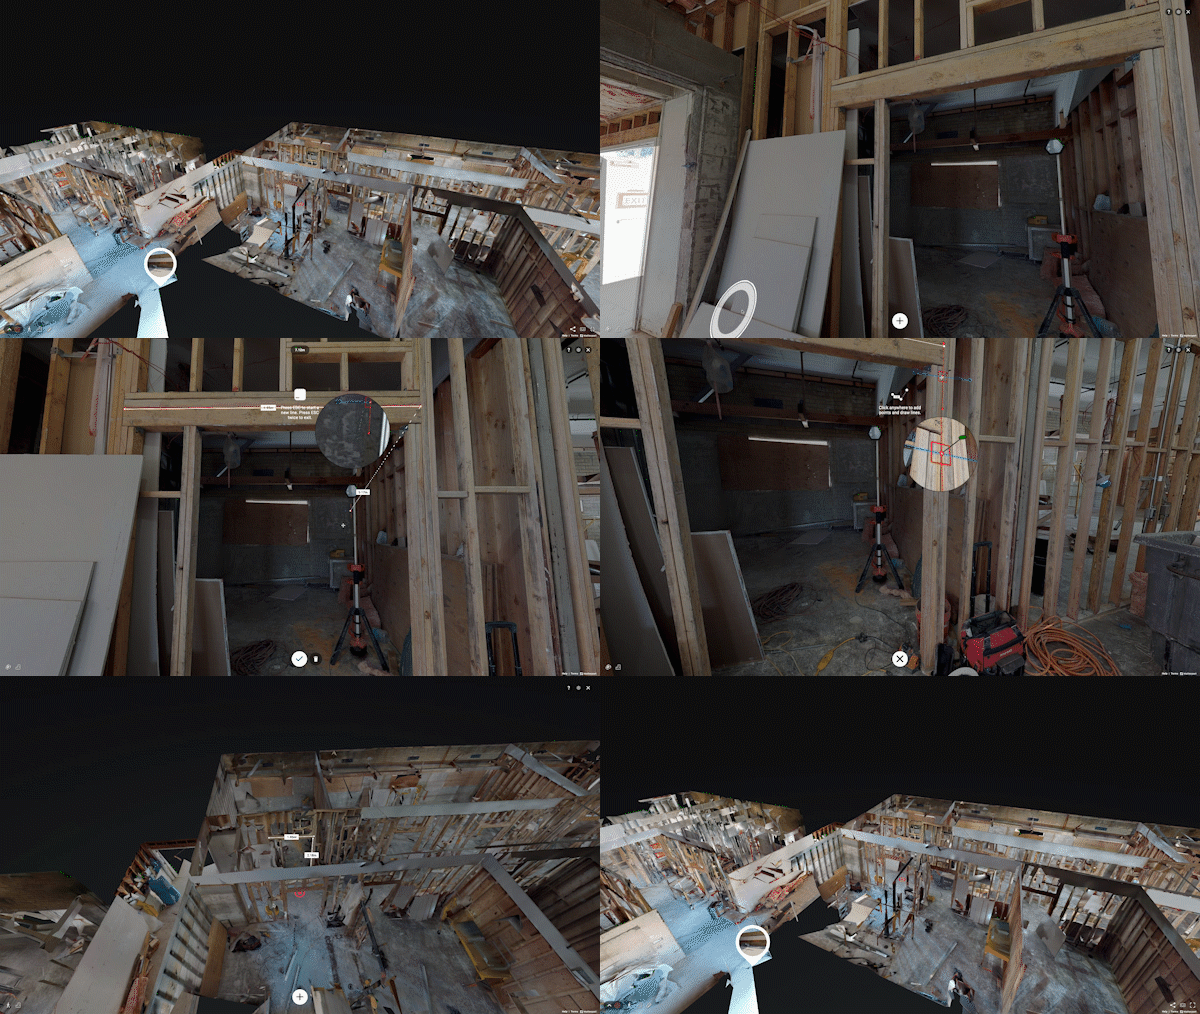
In geometric tools, deviation analysis measures how far a point cloud or mesh has moved from the baseline. It is used when a decision turns on tolerance, like whether a rough-in run stayed within its coordinated clearance. In a digital twin, you can verify dimensions and validate installations using measurement tools directly in the model, so you can confirm a rough clearance or catch glaring problems without site visits.
When you find something that needs action, flag the exact spot for the responsible party. Tags and Notes let you document issues, mark completed work, and leave instructions pinned to precise points in digital twins. For example, if a rough-in run sits outside its coordinated position, you can document the discrepancy at the exact point it occurs, rather than provide an ambiguous description in a written report.
6. Export and share findings
Once you've compared two 3D models, package the results for the people who need them. Match the format to who's viewing it and what they need to do:
Share a digital twin link with owners and executives so they can review progress in a browser.
Share annotations and location-based markups with trades so they can act on specific issues pinned to exact locations in the model.
Share 3D PDFs, screenshots, and reports with team leaders for approvals and formal records.
Track RFIs, Observations, and Coordination Issues using Matterport’s Procore integration so model data and project data live in one system-of-record.
Export point cloud and mesh data for BIM, CAD, and deviation analysis teams to carry the comparison downstream.
It helps to provide tailored information so that different types of stakeholders have the most efficient access to the information they need. From Matterport digital twins, you can spin up a different View for each audience, so trades, owners, and inspectors each get a version scoped to their work without anyone maintaining a separate model.
B.R. & Co. connect Procore and Matterport in their healthcare construction projects to cut in-person inspections across the build, saving thousands per milestone in travel and on-site costs.
When to use visual comparison versus precise deviation analysis
Not every milestone review needs the same level of rigor. Matching effort to task means teams can balance speed, precision, and cost.
Use digital twins for visual, in-context comparison workflows:
Tracking construction progress between milestones where you need to see change quickly, not measure it exactly.
Communicating change to owners and clients who find a browser-based digital twin easier to understand than a point cloud.
Confirming that work is present and roughly correct where a visual check answers "is it there and does it look right" fast.
Reserve precise point cloud or BIM deviation analysis for these cases:
Validating installations against design tolerances where measured deviation confirms whether work falls inside spec.
QA/QC and coordination checks for formal validation of geometry measured against the model.
Resolving very complex disputes like claims that hinge on documented dimensions.
Very precise analysis usually means exporting the capture, as an E57 point cloud or OBJ mesh, into BIM or CAD tools rather than relying on visual digital twin review alone. Here's how the two approaches compare:
Approach | Effort | Accuracy | Best audience |
|---|---|---|---|
Visual, in-context comparison | Low, review in a browser | Qualitative, change in context | Owners, clients, project managers |
Precise deviation analysis | Higher, export to BIM/CAD | Quantitative, tolerance-level | VDC/BIM managers, QA/QC teams |
Compare construction project progress in context with digital twins
For the right workflows, especially progress tracking and milestone validation, digital twins are an accessible, fast, and reliable way to compare two 3D models. They fit the way construction teams actually work across phases and stakeholders.
Accessible: Owners, clients, and subcontractors review changes in a browser without opening Revit or point cloud software.
Fast: Synchronized, in-context review replaces scrolling through hundreds of photos and booking repeat site visits.
Reliable: Captures carry real-world scale and dimensional accuracy, and the same data can feed precise BIM or CAD deviation checks when a workflow calls for them.
Whether you’re comparing progress, reality against design intent, or analyzing deviation, match the method to the milestone and every review will run at the right level of rigor.
Optimisez vos flux de travail AEC/DCM avec Matterport


