


 Iniciar sesión
Hotel Performance Metrics: KPIs That Drive Revenue and Operational Efficiency
Key takeaways
Hotel metrics only improve decisions when commercial and operational KPIs are read together. Two hotels with identical RevPAR can post very different profit, so rate, occupancy, cost, and operations metrics have to be read as one system tied to the same rooms.
Benchmark against a credible comp set, but watch for share bought on rate. A healthy RevPAR index can mask rising cost per occupied room and a weakening GOPPAR, so read index results alongside conversion and cost metrics before calling it a win.
One digital twin works on both sides of that system: it builds the booking confidence behind direct share and conversion, and gives inspection, housekeeping, and maintenance teams a shared, navigable record that keeps rooms sellable.
Picture a quarterly ownership review for a hotel. Occupancy is up two points year over year, ADR held, and the RevPAR index beat the comp set. Then the asset manager shows the profit slide. Total revenue rose, but gross operating profit barely moved. OTA commissions, flexible-rate cancellations, and slow room turns on sold-out nights absorbed most of the gain.
Hotels can only drive better performance when commercial and operational KPIs are read together, because they describe the same rooms.
This guide covers the core hotel metrics and formulas across revenue and operations, how to benchmark them against a credible comp set, and a practical diagnostic for finding where revenue leaks between departments.
Core revenue metrics for hotels
Occupancy, ADR, and RevPAR form the foundation of most hotel metrics reviews, but none of them measures profit.
Metric | Definition | Formula | How it interacts |
|---|---|---|---|
Occupancy rate | Share of available rooms sold | Rooms sold ÷ rooms available × 100 | Can rise as rate falls, adding cost without RevPAR |
Average daily rate (ADR) | Average rooms revenue earned per occupied room | Rooms revenue ÷ rooms sold | Rate gains can cost occupancy, so read both |
Revenue per available room (RevPAR) | Rooms revenue across every room, sold or unsold | Rooms revenue ÷ rooms available, or ADR × occupancy | Combines rate and volume, but ignores cost |
None of these metrics account for the cost of selling and servicing a room. Revenue teams need metrics that subtract that cost, because two hotels with identical RevPAR can deliver very different profits.
Owners and asset managers use the profitability metrics below to judge flow-through:
Metric | Definition | Formula | How it interacts |
|---|---|---|---|
Gross operating profit (GOP) | Revenue left after departmental and undistributed expenses | Total operating revenue - operating expenses | Shows what survives labor, commissions, and utilities |
GOP per available room (GOPPAR) | Operating profit per available room | GOP ÷ rooms available | Profit counterpart to RevPAR that falls when gains cost more |
Revenue per occupied room (RevPOR) | Total spend per sold room, incl. F&B, parking, upsells | Total revenue ÷ rooms sold | Rises with upsells, even when ADR is flat |
Total revenue per available room (TRevPAR) | Revenue from every department per available room | Total operating revenue ÷ rooms available | Credits outlets, events, and fees RevPAR leaves out |
Cost per occupied room (CPOR) | Cost to service each sold room | Rooms department expenses ÷ rooms sold | Rising CPOR erodes GOPPAR while RevPAR climbs |
Read revenue and cost metrics as a pair. RevPAR shows whether the hotel sold its rooms well, and GOPPAR shows whether that selling paid off.
How to benchmark hotel revenue metrics against your comp set
Absolute hotel metrics mean little without context, and benchmarking against a competitive set shows whether gains came from market demand or from share taken from competitors.
CoStar's STR benchmarking uses three indices, as defined in their glossary:
Market penetration index (MPI): Also called occupancy index, calculated as (hotel occupancy ÷ comp set occupancy) × 100
Average rate index (ARI): Also called ADR index, calculated as (hotel ADR ÷ comp set ADR) × 100
Revenue generation index (RGI): Also called RevPAR index, calculated as (hotel RevPAR ÷ comp set RevPAR) × 100
An index of 100 means a hotel captures its fair share of the comp set. Above 100 means it captures more than its fair share, and below 100 means less.
Consider a hotel running at 75% occupancy at a $150 ADR, against a comp set at 70% and $160. Its MPI is 107.1, its ARI is 93.8, and its RGI lands at 100.4 ($112.50 RevPAR against $112.00). On paper, it holds fair share. In practice, it bought share on rate, selling about 7% more rooms to earn the same revenue per available room.
Every extra room carries labor, amenity cost, and often commission costs, CPOR rises, and GOPPAR weakens while RGI looks healthy.
A credible comp includes hotels that compete for the same guests. Check four criteria when building or auditing one:
Location: Hotels that draw from the same demand generators, such as offices, airports, or convention centers
Segment: Similar chain scale, class, and a mix of transient, group, and contract business
Product quality: Comparable room size, renovation timing, amenities, and review scores
Distribution mix: Similar reliance on OTAs, brand.com, and group channels, since channel mix shapes rate
Revisit the set at least once a year and after any nearby opening or closure. Share changes with ownership before index results shift, so a new set does not look like a performance swing.
Market benchmarks help to add additional context and set initial baselines. CoStar and Tourism Economics forecast 2026 occupancy of 63.1% and RevPAR growth of 4.4%.
No single index target fits every hotel, so set RGI goals based on positioning within the set. Index results show whether a hotel won share, and conversion metrics show what that share cost.
Booking, conversion, and guest experience metrics
Where a guest books decides how much of the rate the hotel keeps, and how the stay goes decides whether they book direct next time. The table below covers both.
Metric | Definition | Calculation | Why it matters |
|---|---|---|---|
Direct booking ratio | Share of room nights from owned channels | Direct room nights ÷ total room nights × 100 | Higher share lowers acquisition cost per booking |
Channel mix | Split of room nights by booking source | Channel room nights ÷ total room nights × 100 | Shows reliance on high-commission channels |
Look-to-book ratio | Searches per completed booking | Searches ÷ bookings | A rising ratio signals friction on the booking path |
Website conversion rate | Share of website sessions that end in a booking | Bookings ÷ sessions × 100 | Measures brand.com content effectiveness |
Booking lead time | Days between booking and arrival | Arrival date minus booking date | Shapes pricing windows and stay restrictions |
Length of stay | Average nights per stay | Room nights ÷ stays | Shapes stay restrictions and turn workload |
Cancellation rate | Share of bookings canceled before arrival | Cancellations ÷ total bookings × 100 | Inflates forecasts and leaves late inventory unsold |
Net Promoter Score (NPS) | Guest likelihood to recommend, on a 0–10 scale | % promoters (9–10) − % detractors (0–6) | Tracks loyalty behind repeat and referral demand |
Guest satisfaction scores | Post-stay survey and review ratings | Average score across surveys or review sites | Drives review rankings, visibility, and rate power |
Complaint volume | Logged guest complaints in a period | Complaints ÷ occupied rooms × 100 | Flags operational failures before they reach reviews |
Repeat guest rate | Share of guests who have stayed before | Returning guests ÷ total guests × 100 | Repeat guests are easier to win back |
Read together, these metrics show how much of each booking the hotel keeps and whether the guest returns direct. Improving them starts with knowing what each signal means.
How to read and improve conversion metrics
Read these metrics as signals of booking confidence. A high look-to-book ratio, a high OTA share, and a high cancellation rate often point to content gaps, not demand gaps. Guests who can’t picture the suite or the walk to the pool leave to compare photos and reviews elsewhere.
Virtual tours on the booking path let guests explore layout, flow, and scale before booking, answering the questions that flat photos leave open so they can book with more confidence. In vacation rentals, Vacasa saw conversion rates rise nearly 12% on listings with 3D tours.
A Matterport digital twin tour can be embedded on owned channels such as room pages, the booking engine, and pre-arrival emails. The hotel controls the tour, so the same asset works wherever the listing appears, while the richest experience lives on brand.com.
Increasing hotel bookings via direct channels supports a shift toward higher-margin bookings instead of discount-led occupancy.
Accurate expectations before arrival also protect guest satisfaction. Guests who have already walked the room arrive knowing what they booked, so fewer surprises support review ratings and repeat guest rate.
Measure the effect with an A/B test or a before-and-after comparison, tracking these four metrics for each test group:
Look-to-book ratio by room type, with and without tours
Direct website conversion rate
Cancellation rate by channel
Review scores that mention room size, layout, or accuracy
Hold rate and promotions steady during the test so the result reflects content, not price.
Conversion is only half of the guest experience. The other half happens on property, where operational metrics decide whether the room matches the promise.
Hotel operations metrics that impact revenue
Operations metrics are revenue metrics in disguise, because every room that isn’t ready or is out of order comes off the sellable inventory.
Metric | Definition | Revenue link |
|---|---|---|
Room turnaround time | Time from checkout to ready status | Faster turns protect inventory and occupancy on peak nights |
Time to inspect room | Lag between cleaning and room release | Supports room readiness and early check-in upsells |
Out-of-order room rate | Share of rooms removed from sale for repairs | Each out-of-order night cuts sellable rooms and RevPAR |
Maintenance response time | Time from issue report to completed fix | Slow fixes add out-of-order days and complaints |
Housekeeping productivity | Rooms cleaned per labor hour | Drives labor cost percentage and CPOR |
Guest issue resolution time | Hours to resolve a guest complaint | Shapes satisfaction scores, reviews, and repeat guest rate |
Out-of-order rooms show the cost most clearly. Take 4 rooms out of order for 10 nights at a $180 ADR and 80% expected occupancy:
4 rooms × 10 nights = 40 room nights removed from sale
40 room nights × 80% expected occupancy = 32 room nights that would have sold
32 room nights × $180 ADR = $5,760 in lost rooms revenue
The revenue is gone, but most fixed costs for those rooms remain.
The damage also outlasts the repair. A dripping faucet or a weak air conditioning unit that slips past one inspection shows up later in complaint volume and review comments. Those reviews soften rate power and cost the hotel repeat demand that never appears in the forecast.
How to move operational metrics
Rooms return to sale faster when inspections, maintenance, and housekeeping work from one shared, current record of room condition. Hotels that already use digital twins for marketing have most of that record in place. Within the same model, Views give each team only the details it needs, such as finish standards for housekeeping or equipment locations for engineering.
Faster inspections start with a consistent baseline. Instead of relying on memory of scattered photos, inspectors check each room against its documented standard in the model, shortening time to inspect and release rooms.
When inspectors find a problem, they can use Tags and Notes to pin repair details, photos, and short video instructions to the exact location in the model. When engineers arrive, they already know what needs to be done, cutting maintenance response time and out-of-order days.
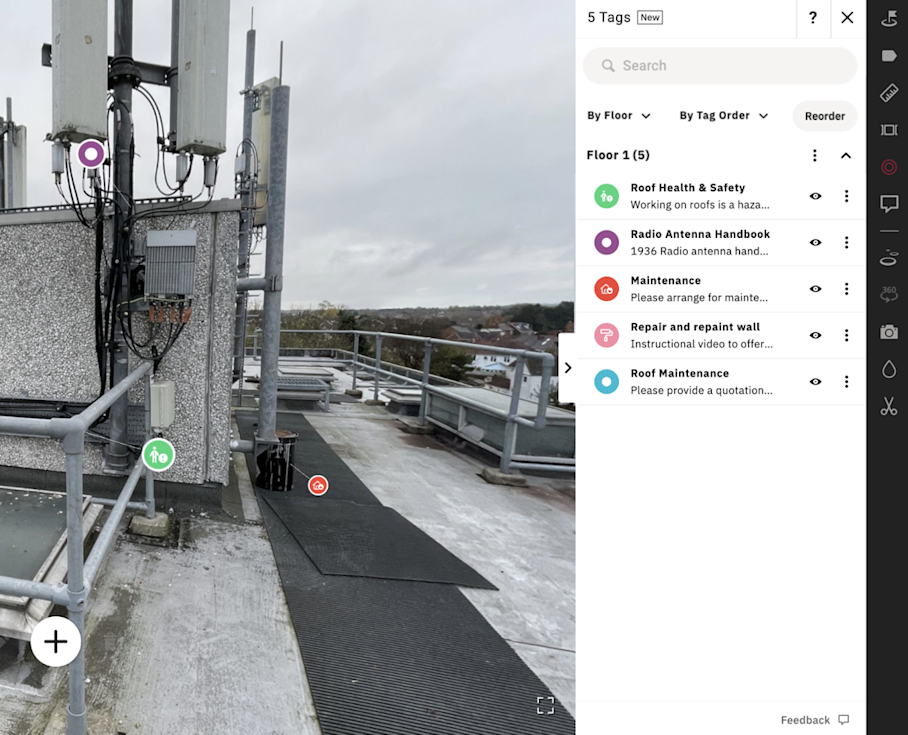
Problems spotted on the floor should reach maintenance the same day. With Field Tags , inspectors log them during the walkthrough, even offline, instead of writing them up later at a desk.
Some condition issues need outside help, and waiting for a contractor to visit and quote delays the fix. With a digital twin, contractors can scope a job remotely, so repairs start sooner, and problems get resolved before they turn into complaints or weak reviews.
Cluster and area teams can only compare out-of-order rates and turnaround times across properties when each room is captured the same way. With Matterport Capture Services, trained technicians scan each property to the same standard and deliver a finished digital twin, so the internal team doesn’t have to travel.
To show the effect, track three metrics before and after rollout:
Out-of-order room rate
Maintenance response time
Guest issue resolution time
Ownership already trusts these metrics, so the results don’t need a new reporting framework. The tool that helps sell the room can also help keep it sellable.
Identifying revenue leakage across hotel efficiency metrics
Revenue leakage hides between departments. A structured review of hotel efficiency metrics separates demand problems from cost, channel, and operations problems. Work through these six steps in order:
Start with RevPAR index to confirm whether the gap is demand or share
Check net ADR by channel to find commission and acquisition leakage
Review cancellation and no-show rates by channel and lead time
Audit length-of-stay restrictions and upsell capture through RevPOR
Review out-of-order rate and room turnaround time for lost inventory
Compare GOPPAR trend against RevPAR trend to confirm flow-through
Manual reporting slows this review down. Centralizing the property management system (PMS), revenue management system (RMS), channel manager, and operations data in one dashboard keeps every step on the same dates and room counts.
When the diagnostic points to an underperforming area, like an unused lounge or a low-demand room type, check the space before deciding to reprice or repurpose it. Spatial data from a digital twin shows how it’s laid out and used. To test a change, teams can compare two configurations of the area, or the same area before and after, in Side-by-Side (public beta).
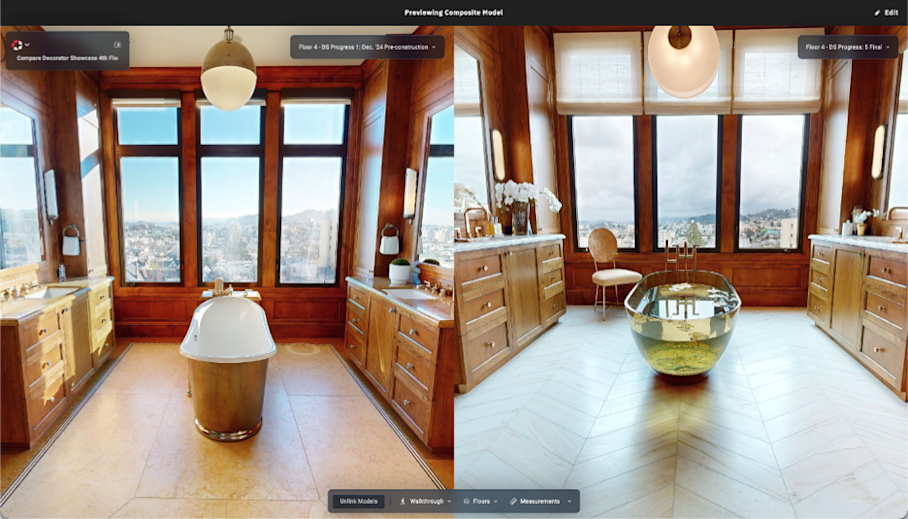
Run the diagnostic monthly alongside the ownership report, so leakage gets caught within weeks instead of at year-end.
Connect commercial and operational metrics for a complete view of hotel performance
Rate, occupancy, cost, guest experience, and profit form one system tied to the same rooms. Hotel metrics read in isolation hide the leakage between departments, but read together, they show where flow-through breaks.
Matterport digital twins support both sides of that system. On the commercial side, they build the booking confidence behind direct share and conversion. On the operations side, the same asset gives inspectors a navigable reference and keeps repair details pinned to each room.
Get started with Matterport for Travel & Hospitality


